Chromatogram
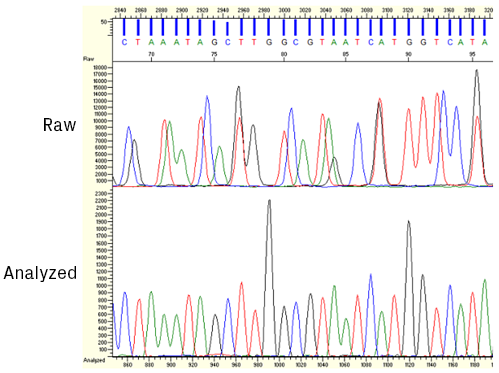
A chromatogram represents the migration of labeled sequencing products via capillary electrophoresis. Fluorescence is detected at the end of the capillary, and signal intensity from four color channels, each representing a DNA base, is plotted on the y-axis relative to time on the x-axis.
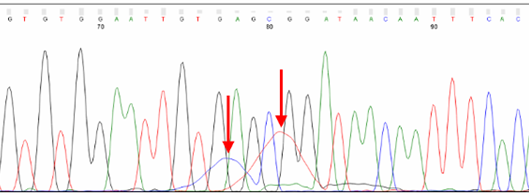
An example of a sequencing chromatogram. Each DNA nucleotide, adenine, cytosine, guanine, and thymine, has its color on the chromatogram for visualization.

Most trace viewers show a processed version of the chromatogram; analysis software manipulates raw data from the sequencer to facilitate base calling. The start of the processed trace, assigned position 1, is the software’s best guess of the first peak.
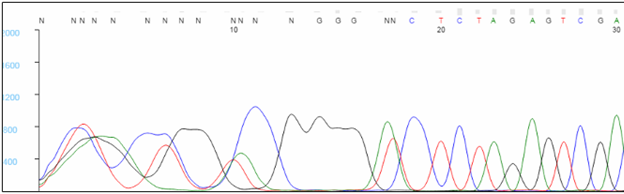
Trace start
The first 20 to 40 bases are typically not well resolved. Very short sequencing products do not migrate predictably during capillary electrophoresis, and the analysis software has difficulty assigning bases within this region, causing Ns to appear in the sequence. To avoid critical data falling in this region, we recommend designing primers that bind at least 60 bp, preferably 100 bp, away from critical bases. Note that the sequence of the primer will not be seen in the results, as bases within the primer are not labeled during the extension reaction.
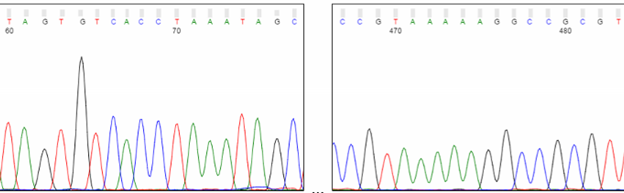
Trace middle
Most sequencing protocols are optimized to provide the best peak resolution between roughly 100 and 500 bases. Peaks should be sharp and well-spaced in this range, and the base calling is most reliable.
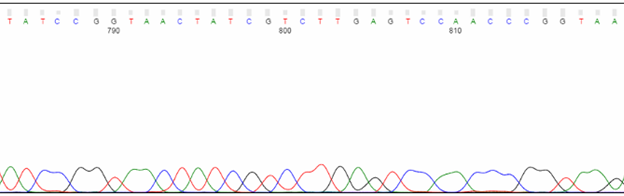
Trace end
Toward the end of the trace, expect peaks to be less defined and lower in intensity. The base calling will also be less reliable. Due to the nature of in vitro polymerization, larger sequencing products are generated less efficiently than their shorter counterparts. Thus, the larger products are fewer in number and produce a weaker signal. Also, with any electrophoresis method, it becomes increasingly difficult to resolve a single-base difference as DNA fragments become larger. For example, the difference in molecular weight between 100 bp and 101 bp is 1%, whereas it’s just 0.1% between 1,000 bp and 1,001 bp.
Dye blobs
Broad C and T peaks may be observed around position 80. Known as “dye blobs,” these peaks represent aggregates of unincorporated dye terminators. Although most cleanup protocols are effective at removing leftover nucleotides after completion of the sequencing reaction, no method is 100% effective. Dye blobs are more frequently observed in inefficient sequencing reactions, with a higher fraction of unincorporated nucleotides and a low signal-to-noise ratio. Please note that the sequence within this region can often be determined by manual inspection of the chromatogram, even if the analysis software is unable to assign bases (i.e., Ns appear in the sequence). Suppose you need to sequence a key base, such as an SNP. In that case, we recommend using primers that bind at least 100 bp away from the key base to avoid it falling within the dye blob region.
Assigning bases
Once the sequencer collects the raw data, it’s processed and analyzed by base-calling software. The four dyes used in Sanger sequencing have slightly different mobility properties due, in part, to their unequal molecular weights. Therefore, the relative position of the peaks must be slightly adjusted to compensate for these differences (see figure below). After this correction, the algorithm identifies peaks and assigns bases.