Dot plot
A dot plot is a graphical method used in bioinformatics to compare two biological sequences, revealing their similarity and differences at a glance. This technique plots one sequence along the x-axis and the other along the y-axis of a two-dimensional matrix. Points, or “dots,” are marked on this matrix wherever the elements (nucleotides in DNA/RNA or amino acids in proteins) from one sequence match those from the other sequence based on a predefined criterion. It serves as a preliminary step in sequence analysis, helping researchers visualize alignments, repetitions, inversions, and regions of conservation without the computational complexity of more advanced alignment algorithms.
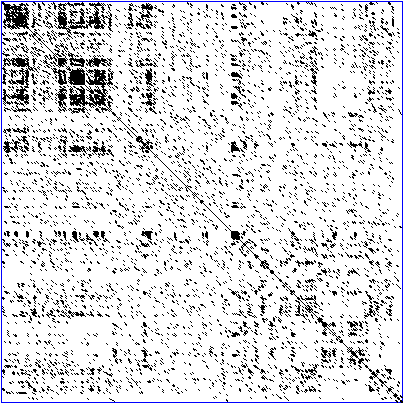
This is a DNA dot plot of a human zinc finger transcription factor (GenBank ID NM_002383) showing regional self-similarity. The main diagonal represents the sequence’s alignment with itself; lines off the main diagonal represent similar or repetitive patterns within the sequence.
Credit: Wikipedia
Interpretation
When analyzing a dot plot for sequence alignment, you start at the upper left corner, marking the beginning of both sequences being compared. This point is crucial as it signifies the commencement of the analysis. Conversely, the path concludes at the lower right corner, which denotes the endpoint of both sequences, encapsulating the entire comparison within the confines of the plot. The path through the dot plot is navigated via three principal directions:
- eastward (right) along the x-axis, which indicates progression in the x-axis sequence without a corresponding match in the y-axis sequence, suggesting a gap or insertion in the sequence represented on the y-axis;
- southward (down) along the y-axis, which signifies advancement in the y-axis sequence without a matching element in the x-axis sequence, hinting at a gap or insertion in the x-axis sequence;
- and southeastward (diagonally down and right), which denotes a matching pair of elements, thus advancing both sequences in unison.
Interpreting alignments within this framework, any path that adheres strictly to these three directions from the plot’s upper left to its lower right corner symbolizes a potential alignment between the two sequences. This path methodically delineates through regions of matches (diagonal movements) and mismatches or gaps (lateral or downward movements).
When the sequences under comparison are highly similar or closely related, the path of optimal alignment is expected to predominantly traverse diagonally, reflecting a substantial degree of matching between the sequences. Such clear, uninterrupted diagonal lines illustrate sequences of consecutive matches, enabling direct interpretation of the alignment from the dot plot. This direct reading of alignments becomes particularly feasible when the sequences are closely related, as a continuous diagonal line (or lines) stretching from the upper left to the lower right corner of the dot plot allows for the alignment to be intuitively “read” off the plot. By observing the path’s direction changes, one can effortlessly deduce the sequence of matches and mismatches, including the strategic positioning of gaps, thereby offering a visually intuitive method to understand sequence alignment through dot plots.